
Sample DashIQ audit
A real audit of a QuickLaunch Analytics accounts payable dashboard. Upload yours to get the same breakdown.
What's the gross AP amount exposure across companies, business units, and suppliers for 2025 period 6?
This is a solid accounts payable monitoring build. The KPI row leads clearly, slicers are organized on the left rail, and the refresh timestamp is visible. The score is held back by a treemap that asks readers to compare areas instead of lengths, and by a line chart spike that has no annotation explaining what happened in June.
What's working
- KPI cards sit at the top in priority order (Gross Amt, Discount Available, Suppliers, Invoices), matching Stephen Few's executive scanning pattern.
- The slicer panel is organized down the left rail with a manageable set of filters (Year, Period, Company, Supplier).
- The 'AP Amt Gross by Company' and 'by Supplier' bar charts are sorted descending, so the biggest exposures read first.
- A 'Last Refresh' timestamp is visible in the bottom-left, which builds trust in data freshness.
- The dashboard commits to one clear question, AP gross exposure, rather than trying to be a general-purpose report.
Annotated screenshot
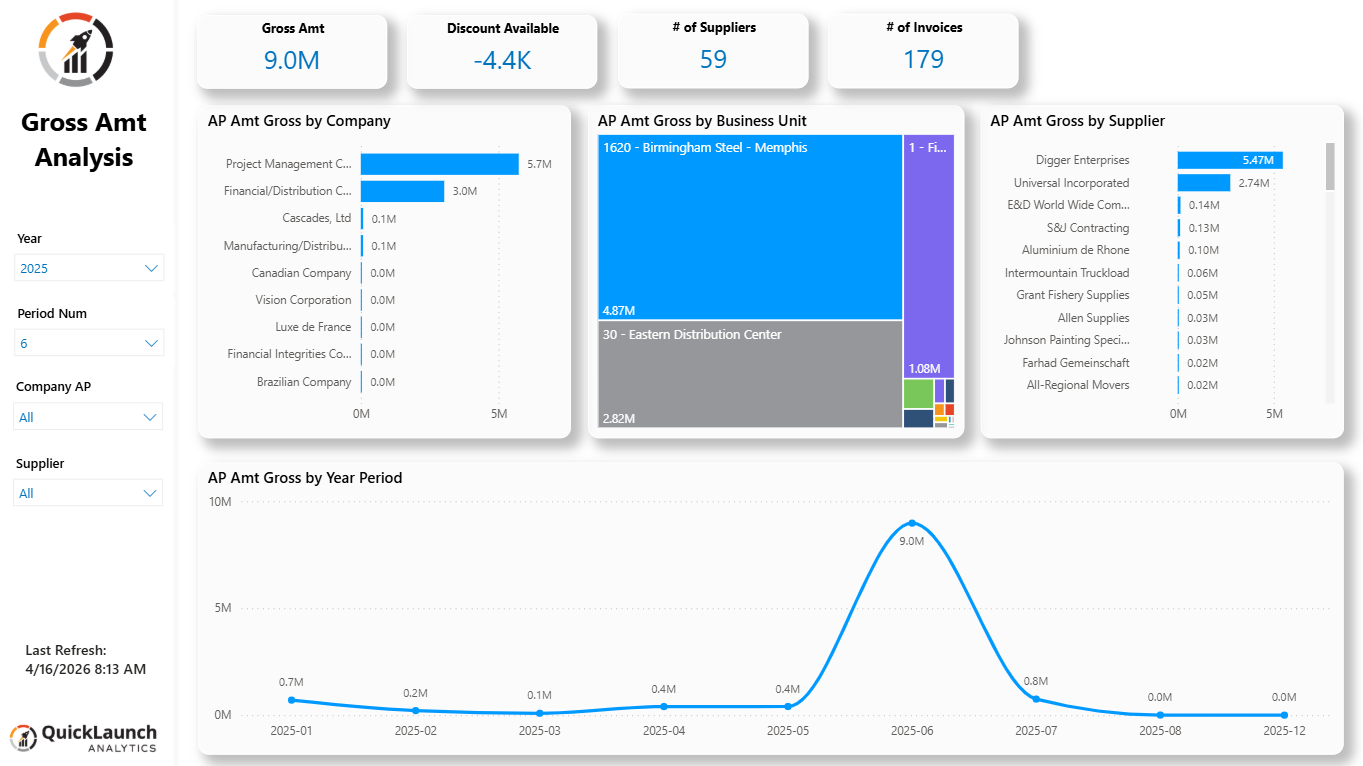
Hover a marker to highlight its finding. Click a marker to jump. Click Expand for full size.
Findings (2)
Treemap used for 'AP Amt Gross by Business Unit'
The business unit breakdown uses a treemap, where value is encoded as rectangle area. Beyond the two large blocks (Birmingham Steel, Eastern Distribution Center), several small colored rectangles in the bottom right have no visible labels or values.
Why it matters: Cleveland and McGill's 1984 ranking places area below length in accuracy; readers can't reliably judge whether the small unlabeled blocks differ from each other.
How to fix: Replace with a horizontal bar chart sorted descending, or add data labels to every rectangle in the treemap so the small segments are still readable.
Unexplained spike in 'AP Amt Gross by Year Period'
The trend line jumps from roughly 0.4M in May to 9.0M in June, then drops back down, with no annotation or callout explaining the spike.
Why it matters: A reader scanning the trend has no way to tell if this is a data entry event, a bulk invoice batch, or an anomaly worth investigating, which slows down the reading of the chart's main story.
How to fix: Add a text annotation or a reference line callout on the June data point, or add the AI-powered 'Analyze' quick insight to explain the variance.
Polish
Small refinements worth making. These don't affect your score.
Generic page title
The page title reads 'Gross Amt Analysis' without a time period or scope.
Why it matters: Not an impact-test failure since the Year slicer shows 2025, but a self-describing title helps if the page is shared as a static export.
How to fix: Bind the title text box to a measure that concatenates the selected year and period, e.g. 'AP Gross Analysis: 2025 Period 6'.
Long supplier and company names truncated with ellipsis
Category labels like 'Project Management C...' and 'Financial Integrities Co...' are cut off in the bar charts.
Why it matters: Readable via hover tooltip, so this doesn't block the reader, but it costs a small amount of scanning speed.
How to fix: Widen the category label column or reduce font size slightly in Format > Y-axis.
Ideas to try
Beyond fixes: ways to get more out of this dashboard, based on what your data shows and the Power BI features that fit it. They don't affect your score.
Add a Pareto view of supplier concentration
Digger Enterprises and Universal Incorporated dominate the supplier bar chart while the rest trail off sharply. A cumulative percentage line would show what share of AP gross sits with the top few suppliers.
How: Add a line-and-clustered-column chart with a running-total measure using RANKX and a cumulative SUM, or use the built-in Top N filter with an 'Others' bucket.
Let users drill into the June spike
The June peak on the trend chart is the most visually striking element on the page but offers no explanation. A drill-through page filtered to that period would let a user click the point and see the invoices behind it.
How: Set up a drill-through page filtered by Period Num, and enable right-click drill-through or a button on the line chart.
Give the KPI cards trend context
Gross Amt and Discount Available show single numbers with no comparison to a prior period, so the reader can't tell if 9.0M is high or normal without scanning the line chart separately.
How: Migrate to the new Card visual with a reference label showing prior period or prior year value alongside the main number.
Recommendations to verify
These items aren't visible in the screenshot. Check whether they're already addressed; if not, consider them as next-step upgrades. They don't affect your score.
- Verify whether the visuals use Power BI's page tooltips for richer hover context. Suppliers with truncated names would benefit from a tooltip showing the full name and a mini trend.
- Confirm a custom theme JSON file governs the blue accent and gray palette across other pages in this report, not just this one.
- Check whether the treemap's small unlabeled segments correspond to real business units worth breaking out, or whether they should be grouped into an 'Other' category.
The takeaway
The dashboard is functional and answers its question well for someone who already knows the business units involved. Swapping the treemap for a bar chart and annotating the June spike would close most of the gap, and both are quick fixes. The bigger opportunity is giving the KPI row and the spike some comparative context so a reader can tell good from unusual without guessing.
See what DashIQ says about yours
Upload a screenshot of any Power BI report page. Your score shows in about 30 to 60 seconds, and your screenshot is never stored.